Measuring Intellectual Property: Top 5 IP Metrics

The importance of Intellectual Property (IP) has increased significantly in the past 20 years. The technology boom of the late 1990s showed the world that packaged IP was often worth more than the products that contained it. IP moved from the back office to the corner office.
Business processes were changed to enable IP caretakers to work more closely with IP creators. The workforce was educated to give everyone a better understanding and appreciation. File folders and spreadsheets were replaced with IP management systems. More active selling, licensing, and bartering of IP spawned new service industries to facilitate IP transactions. The table was now set for many new performance measures.
Historical IP Metrics: For decades, IP metrics were simple and focused on inventory and costs. Patents were always expensive, as were the processes to protect Trade Secrets. CFOs managed IP assets as expenses, trying to minimize the cost. Companies had the same metrics, portrayed in the same way: patent disclosures, patents filed/pending/granted/rejected/maintained/abandoned, and the costs thereof. The Trade Secret metric was “number of trade secrets.” This analysis is simplified to make the point. Today’s situation couldn’t be more different.
IP Metrics Today: All historical IP metrics are still used. Keeping track of IP inventory and status is a “legal” issue. “Industry-standard categories” do not exist. Four categories will be used to make the points of this article: IP Revenue & Profit Contribution; IP Portfolio & Asset Value; IP Strength & Quality; and IP Organization & Productivity. A few selected metrics will be used to illustrate each category. These categories will grow and sub-divide over time.
IP Revenue & Profit Contribution: Some two-thirds of all companies track their new product sales (and profits). With ever-shortening product life cycles, IP protection helps keep margins from eroding and competitors from knocking off the product. “IP-Protected Revenues (and Profits)” has emerged as an important metric. “% Revenues from Licensing” is also growing in popularity, as is “% Profits from Licensing.” When compared to deducting product cost from revenue to determine profit, licensing is almost all profit.
IP Portfolio & Asset Value: Patent valuation is still an art. CFO thinking has evolved to now appreciate IP as an asset, not just a cost, as they strive to assign “Value of the Patent Portfolio.” Wall Street is sure interested. Analysts and investors are eager for better information to determine if a stock really is worth 60 times earnings versus the historical 12 or 15 times earnings. “IP Portfolio Growth Rate” is also important in many industries.
IP Strength & Quality: Not all patents or trade secrets are created equal. Given the great costs of filing and maintenance, strength and quality may be the differentiators regarding decisions to file and/or maintain. Defensive measures such as “Patent Robustness” and “Legal Strength” get at a competitor’s ability to invent-around. “Business Relevance” and “Technology Strength” help make a financial determination of value, as do “Citations, Backward/ Forward.”
IP Organization & Productivity: This big category covers everything from the size of the staff and organizations that process and take care of IP to the efficiency and effectiveness of individual pieces/blocks of IP. Organization metrics include: Lawyer and/or Staff Headcount; Lawyers per $$ of Company Revenues; Patents per Lawyer; Inventor Headcount; Patents per Inventor, and Revenue/Profit per Inventor. Productivity metrics include: Disclosures per Filed and/or Granted Patent; Revenues/Profits per Patent; Lifecycle Cost per Patent or Trade Secret; and numerous others.
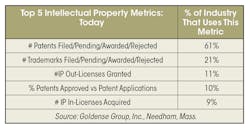
Top 5 IP Metrics: There are now over 150 IP-specific metrics companies use, or are experimenting with. GGI research shows historical inventory/status measures still have the greatest corner-office presence, around 60% for Patents and 21% for Trademarks. # IP Out-Licenses has risen to 11% from nowhere 20 years ago, followed by % Patent Applications Approved at 10%, and # IP In-Licenses at 9%. The next 20 years will be exciting for those that seek to quantify IP performance.
About the Author
Bradford Goldense
Contributing Technical Expert
Bradford L. Goldense is founder and president of Goldense Group, Inc. [GGI] (www.goldensegroupinc.com), a consulting, market research, and education firm focused on business and technology management strategies and practices for product creation, development, and commercialization. He has been an adjunct faculty member of the graduate engineering school at Tufts University's Gordon Institute for 19 years. Goldense is a Certified New Product Development Professional [NPDP], a Certified Manufacturing Engineer [CMfgE], a Certified Computer Professional [CCP], and is Certified In Production & Inventory Management [CPIM]. He holds over 200 registered copyrights and is a recognized subject-matter expert, including appearances on PBS and CNBC. He has consulted to over 250 companies and over 750 manufacturing locations on four continents since founding GGI in 1986. Goldense holds an MBA in Accounting from the Cornell Johnson School and a BSCE from Brown University. For more information, please see Brad's LinkedIn profile or visit GGI's home page.
Voice Your Opinion!
To join the conversation, and become an exclusive member of Machine Design, create an account today!

Leaders relevant to this article: