Top 10 Product Development Metrics: Then & Now

Download this article as a .PDF
Metrics change slowly. This is especially true in R&D and product development, and for many reasons. New business processes take years to evolve and become the new normal. Then, new measures get adopted. The infrastructure behind metrics is complex. People have to change what they track and record, then IT has to put it into a system. Management is uncomfortable with new metrics that do not have several years of past data. Few choose to recreate that data rather they wait several years for it to accumulate.
As well, R&D and product development are among the least understood major business functions. Business leaders hesitate to change measures in areas where they did not have direct experience on their way to the top of the corporate ladder. As a result, the leaders of innovation departments chartered with inventing the future have enjoyed less oversight than they probably should have—for a long time. Until now.
Historical Measures of Product Development: Prior to World War II, there was not a great deal of focus on measuring product development. WWII necessitated that western countries accelerate their pace of invention and deployment, and the importance of measures rose. Between WWII and the 1990s, product life cycles remained quite long. As a result, the types of measures that were needed focused on assuring adequate resources were in place and companies were not overspending.
In the 1990s, the first glimpses of globalization crept in. As well, the pace of technology cycles quickened. As the level of competition and faster technology changeover rose, product life cycles began shortening. These macro changes raised the importance of execution across all company innovation functions. Improved processes were required; first came Stage-Gate®, followed by flexible, agile, and lean after the turn of the Millennium.
As previously explained, metrics lag process improvement. Sure, there were new metrics introduced during that period, but they were additions to the types of metrics that had existed for decades. Until the beginning of The Great Recession, R&D and product development metrics focused on the amount of resources in place and on their ability to execute to plan.
Today's Measures of Product Development: Profound changes in measurement approaches could not be seen at the start of what we now call The Great Recession because at the start few could foresee that The Great Recession would go on for nearly a decade. But by the end of that period, much had changed. Spending on “new-to” inventions and innovations in R&D had been cut by nearly 50% (MD June ’17). For the monies that were allocated, mostly to incremental product extensions and cost reductions, it was imperative that every dollar spent created some type of business result that leveraged the existing product portfolio. Monies could no longer be put into R&D without attaining some tangible business result.
As well, it was no longer good enough to simply generate incremental revenues. Bottom-line pressures were so great that these efforts also needed to yield incremental profits. And results had to be clearly visible.
After decades of measuring the resources and execution abilities of inventive departments and professionals, economic conditions necessitated that the most important thing now was to measure the business results and financial contributions of all technology and project investments. Measures of profit, the product portfolio, and knowing the big picture results became the necessary imperative.
Measures of contribution and results had always been present. They were used by industry leaders, but not widely adopted within and across industries.
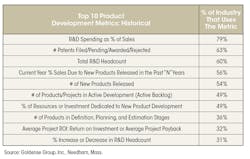
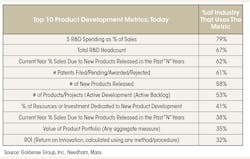
Historical vs. Today: Seven of the Top 10 measures remained the same: $ R&D Spending, # R&D Headcount, % New Product Sales, # Patents, # New Products, # Products In The Pipeline, and % R&D Spending on New Products. However, the metrics that measured resources and activities dropped down while measures of business and financial results rose.
The last three of the Top 10 historical measures of activities and execution (# Products in Planning, Change in R&D Headcount, and Average Project Payback) were replaced by % New Product Profits, Portfolio Value, and Overall Return-On-Innovation. Together, the rearrangement of the Top 7 metrics combined with the replacement of the final three of the Top 10 metrics constitute a widespread change across industry to focus on the business results generated, and not on the activities undertaken.

About the Author
Bradford Goldense
Contributing Technical Expert
Bradford L. Goldense is founder and president of Goldense Group, Inc. [GGI] (www.goldensegroupinc.com), a consulting, market research, and education firm focused on business and technology management strategies and practices for product creation, development, and commercialization. He has been an adjunct faculty member of the graduate engineering school at Tufts University's Gordon Institute for 19 years. Goldense is a Certified New Product Development Professional [NPDP], a Certified Manufacturing Engineer [CMfgE], a Certified Computer Professional [CCP], and is Certified In Production & Inventory Management [CPIM]. He holds over 200 registered copyrights and is a recognized subject-matter expert, including appearances on PBS and CNBC. He has consulted to over 250 companies and over 750 manufacturing locations on four continents since founding GGI in 1986. Goldense holds an MBA in Accounting from the Cornell Johnson School and a BSCE from Brown University. For more information, please see Brad's LinkedIn profile or visit GGI's home page.
Voice Your Opinion!
To join the conversation, and become an exclusive member of Machine Design, create an account today!

Leaders relevant to this article: