Fatigue in Welded-Steel Structures
For engineers who design welded-steel structures subject to dynamic loading, fatigue life is normally a top priority. Whether welding together a few relatively simple parts or fabricating large, complex structures, weld fatigue is likely to be the most-common failure mode if the part or structure is subjected to fluctuating stresses.
In fact, on the very first page of his classic work, Fatigue of Welded Structures, T. R. Gurney gets right to the point, stating that an estimated 90% of all failures in engineering components are due to fatigue. Therefore, heading off potential fatigue issues is always beneficial, both for manufacturers and users.
Although fatigue may be of concern for stationary equipment such as power generators or machine tools, it is particularly important when designing and fabricating steel frames for mobile equipment such as agricultural, construction, mining, and material-handling machines. That’s because mobile equipment experiences larger magnitude and much-more unpredictable dynamic loadings.
This may also be the case with structures that, on the surface, appear to be “static.” Classic examples are bridges subject to varying loads from crossing vehicles; and buildings that see variable wind loads and cyclic occupant traffic.
Steel considerations
When considering fatigue analysis of steels, it is important to note a critical distinction between two broad classes of steels:
Class 1. High-quality, “clean” steels with precision machined and polished surfaces. These steels are usually high strength and typically not welded. In fact, most of these steels do not have chemical or mechanical properties suitable for welding. Typical material classifications include some of the higher strength SAE steels such as 4140, 4340, and 52100. Transmission components like gears, shafts, and bearings are good examples of products made from this class of steel.
Class 2. Mill rolled, formed, and flame-cut shapes. Fabricated-steel plates, bars, tubes, wide-flange beams, and other shapes are typically made from lower-strength steels. These steels have been metallurgically designed with chemical and mechanical properties that foster good weldability. Typical examples are the ASTM classes of steels, such as A36, A572, and A514.
While parts made from either class of steel can (and do) suffer fatigue failures, the theoretical methods used to predict their fatigue lives are vastly different. For Class 1, material tensile strength heavily influences fatigue life. Up to a limit of about 200,000 psi, the higher the tensile strength, the longer a component’s predicted service life. For Class 2, fatigue life is completely independent of material strength, as will be discussed later.
Another basic fatigue property that makes steel unique compared to most other metals is its apparent endurance limit. One of the foremost authorities on steel alloys (and other materials) is ASM International, based in Materials Park, Ohio. In their Handbook Series, Volume 1: Properties and Selection: Irons, Steels, and High-Performance Alloys, the article “Fatigue Resistance of Steels” defines this characteristic as:
“Fatigue limit (or endurance limit) is the value of the stress below which a material can presumably endure an infinite number of stress cycles, that is, the stress at which the S-N diagram becomes and appears to remain horizontal.”
However, a word of caution is in order when associating endurance limit with welded steels. Although some data do seem to indicate an “infinite” life by extrapolation, particularly for Class 1, this is somewhat open to interpretation for Class 2 because there tends to be a substantial number of microscopic flaws (where fatigue cracks initiate) in and around welded joints. Also, no significant amount of testing has been done beyond about 10 million cycles for large-scale welded structures.
Fatigue background
Due to the severe nature of fatigue failure, much research has been conducted over the past few decades in an effort to both predict service life and reduce the number of failures. For more details on these research efforts, visit the online article, “The Development of Welded Steel Fatigue Design Guidelines.”
One group behind much of this work is the Transportation Research Board, headquartered in Washington, D. C. It is one of six major divisions of the National Research Council – a private, nonprofit institution administered by the National Academy of Sciences, the National Academy of Engineering, and the Institute of Medicine.
The TRB’s National Cooperative Highway Research Program (NCHRP) – Report 102, “Effect of Weldments on the Fatigue Strength of Steel Beams,” defines fatigue as “the initiation and propagation of microscopic cracks into macroscopic cracks by the repeated application of stresses. These stresses individually are not large enough to cause static failure, but if the macroscopic cracks are allowed to increase in size, structural failure of the member will result from the reduction in effective load-carrying area of the cross section.”
Anyone who has ever experienced a structural fatigue failure certainly understands just how abruptly this phenomenon can occur. In fact, this is the main distinction between static and fatigue failure. Static failures are often easy to detect because they’re accompanied by obvious plastic deformations. Consequently, they often do not proceed to the point of catastrophic failure.
Fatigue failures, on the other hand, usually happen suddenly and often catastrophically. This is why manufacturers of equipment subject to fatigue usually instruct users and maintenance personnel to periodically inspect and perform nondestructive tests to check for fatigue cracks. These tests can range from simple visual inspections to more-extensive tests, such as ultrasonic imaging.
Although it is beyond the scope of this article, several “weld-improvement” techniques have been shown to lengthen fatigue life. Mechanical examples include shot-peening and other cold-working techniques that introduce compressive stresses into the outer surfaces of weld joints.
Another example is thermal stress relieving, in which relatively small parts or structures are heated in an oven to a predetermined tempering temperature, and then slowly cooled. These and other techniques mitigate or “relieve” residual stresses commonly produced during welding.
It is also important to remember that the fatigue life of welded structures is independent of material strength. In fact, in some cases, higher-strength steels such as class A514 prove to be less fatigue resistant than lower-strength steels like A36. This most likely stems from the relative weldability of these materials: A514 is more difficult to weld than A36. Tests show that fatigue cracks initiate at some initial discontinuity in the weldment and tend to grow perpendicular to the applied stress. Some examples of typical discontinuities or weld defects are porosity, inclusions, incomplete fusion, trapped slag, trapped hydrogen, and high-hardness gradients (usually from inadequate preheat).
Quantifying fatigue data
Thanks to extensive research by multiple organizations in several countries over the past 40+ years, the relationship between fatigue life and stress range has been firmly established. For example, NCHRP Report 286: “Evaluation of Fatigue Tests and Design Criteria on Welded Details,” defines fatigue life, N, as:
N = A/SrB = ASr-B
or
log N = log A – B•log Sr
where N = life in cycles, Sr = stress range (not stress magnitude) in ksi, A = fatigue detail category coefficient, and B = the “slope” of the fatigue curve.
Here’s a closer look at these parameters:
Fatigue curve slope (B). Based on regression analysis of the aforementioned research test data, the exponent B was found to be approximately 3.0. (More details can be found in NCHRP Report 286.)
In practical terms, these findings suggest that fatigue life is inversely proportional to the cube of the stress range. Thus, even a slight change in stress range can profoundly affect life. For example, increasing the stress range by only 10% will reduce predicted life by 25%. Doubling the stress range will reduce life by a factor of eight!
Stress range (Sr). Stress range, by definition, is simply the difference between the maximum and minimum stresses:
Sr = Smax – Smin.
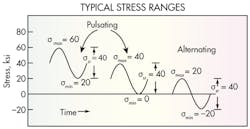
In fatigue analysis, the stress range is always cyclical. A typical illustration of this concept is shown in the “Typical stress ranges” graphic, where some possible stress-range conditions are represented by three sinusoidal curves. In each case, the stress range is identical (40 ksi), but stress magnitudes vary substantially (from –20 to 60 ksi). The figures also illustrate the two different types of stress ranges:
- Pulsating: Smax and Smin are both tensile (or both compressive).
- Alternating: Smax is tensile and Smin is compressive.
A good example of a pulsating stress range can be found in the frames of moving off-highway equipment. Navigating the machine and its load over various obstacles or rough ground introduces vertical, lateral, and longitudinal accelerations — and that generates pulsating stress ranges throughout the frame members. This is represented by the first curve.
A bridge-crane beam is another example of a member subjected to variable loading that produces a pulsating stress range. As a load is placed on the hook, stress in the beam ranges from zero to the Smax corresponding to that load. When the load is removed, stress returns to zero. This constitutes one load cycle, such as the one shown in the second curve.
The classic example of a fully alternating stress range (the third curve) is a rotating shaft under a bending load, such as an agricultural tractor rear-wheel axle shaft. Although quantitatively, a pulsating stress range may have the same magnitude as an alternating stress range, qualitatively, alternating stress ranges in welded structures (especially fully alternating, where Smax = Smin) tend to be more severe. They’re more likely to cause fatigue cracks to propagate.
Again, this is a major distinction between static and fatigue failures. Static failures only occur at stresses at or above the material’s yield strength. Fatigue failure, on the other hand, can happen at a stress range with small-magnitude stresses. In fact, the average stress magnitude for the fully alternating case is zero.
Finally, when calculating stress range, it is important to use global stress values (such as Mc/I or P/A type stresses), not local stress-concentration values, such as those present at a welded discontinuity. That’s because most research correlating fatigue life and stress range has focused on realistic geometrical discontinuities. The intent was that calculated stresses be nominal stresses determined by appropriate analysis methods, not localized “hot-spot” stresses (a notch effect, for example) that finite-element analysis might uncover.
Fatigue detail category coefficient (A). To establish the relationship between fatigue life and welded joint detail, seven basic fatigue categories have been established: A, B, B’, C, D, E and E’. Each is based on actual test-to-failure of specific joint types and geometries. These range from plain as-rolled material away from any welds (Category A) to abrupt geometric and metallurgical gradients that create severe stress concentrations (Category E’). See the sidebar, “Classifying fatigue resistance,” for more information and examples.
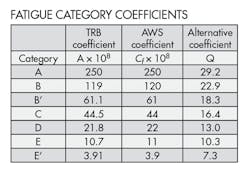
Thus, the coefficient A in the NCHRP equations is strictly based on the welded-joint detail and geometry. Values for A for each category are listed in the “Fatigue category coefficients” table.
Fatigue life
Two common expressions relate cycle life and stress range. The first is from NCHRP Report 286:
N = A/(Sr)3
and the second from American Welding Society AWS D1.1-2006:
N = Cf /(Fsr)3.
N = number of cycles; Srand Fsr = allowable stress range (ksi); and A and Cf are fatigue detail category coefficients. Although the nomenclature differs, it is obvious these two equations are identical. An alternative, perhaps more “user-friendly” form of equation is:
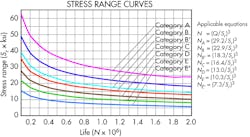
N = (Q /Sr)3
where, Q = (A/106)1/3 = (Cf /106)1/3 = allowable stress range for 1 million cycles.
In this case the coefficient Q is derived directly from the AWS Cfcoefficient and effectively represents the stress range at which a specific joint would have a predicted life of 1 million cycles. See the “Fatigue category coefficients” table and the “Design stress range curves” for specific details.
One challenge for engineers applying this equation lies in specifying the correct fatigue category and coefficient. One of the best resources for pairing joint details with the proper fatigue category is AWS D1.1, Table 2.4: “Fatigue Stress Design Parameters,” which contains seven sections with about 80 illustrative examples.
Intuitively, it is obvious that some joints resist fatigue better than others. A joint with welds parallel to the applied stress is usually much less fatigue sensitive than one with welds transverse to the applied stress. Also, the more abruptly a section changes, the more severe the fatigue class. Of course, if the section change is in a low-stress-range area, a low-fatigue category may be acceptable.
Consider these examples. A beam with upper and lower flanges connected by a web welded with continuous, longitudinal fillet welds is Category B. If a cross member were attached to the upper flange with transverse full-penetration groove welds, the more gradual the section change, the better the fatigue category (from Category B with a 24-in. radius down to Category E with a 2-in. radius). If, however, a relatively small bracket were welded to the top flange of this beam, the category could drop drastically from B down to E or even E’, and it does not matter whether the bracket is load bearing or not. As welded-structures expert, Omer Blodgett, once said, “There are no secondary members in welded design.”
Classifying fatigue resistance
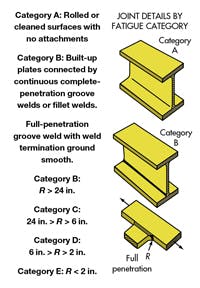
Category A includes plain base-metal material with rolled or cleaned surfaces, away from welds, rivets, and bolts. This category has the best fatigue resistance.
Categories B and B’ encompass welded structural details such as longitudinal continuous welds in built-up plates and shapes. Category B’ has constructions similar to those in B that are more sensitive to fatigue.
Category C includes transverse stiffeners, short attachments (less than 2 in.), transverse groove welds where the reinforcement has not been removed, and connections with a gradual transition radius (6 to 24-in. radius).
Category D includes welded short attachments (2 to 4 in.) and connections with more-abrupt transition radii (2 to 6 in.).
Categories E and E’ welds have the lowest fatigue strength. A few examples include intermittent fillet welds, welds at the ends of partial-length beam cover plates, longer attachments (more than 4 in.), and connections with a sharp transition radius (less than 2 in.). Of all the different welded constructions, those in those in Categories E and E’ are the most susceptible to fatigue crack growth.
Part 2 of this article will discuss how to apply fatigue data and present some practical examples of life calculations.
Voice Your Opinion!
To join the conversation, and become an exclusive member of Machine Design, create an account today!

Leaders relevant to this article: