When getting from point A to point B is all you’re worried about, simple step inputs usually suffice. But when your machine’s movement between points needs smooth elegance, then a complex, controlled input is required. In the 1930s Hendrik Wade Bode introduced a way to plot a linear system’s response to this sort of modulated, periodic signal. (For nonlinear systems, dynamics can be linearized about operating points.)
Bode’s notation takes advantage of the fact that, for a given sinusoidal input, the resulting output is always sinusoidal, and usually at the same frequency as the input. However, system characteristics based on the storage and release of energy often warp magnitude and phase. The two charts of a Bode diagram (the log of gain or magnitude, and phase plots) visually reveal these distortions.
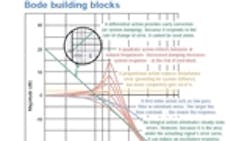
Another way of slicing and dicing information, poles and zeros embedded in Bode plots contain information that is useful in other types of analysis.Poles are values of s that cause the transfer function’s denominator to go to null; zeros push its numerator down. Zeros can be positive or negative, but only unstable systems (such as oscillators) have any poles with positive real parts. A negative pole in a Bode plot contributes -90° to the phase and -20 dB/decade to magnitude; a negative zero adds 90° and 20 dB/decade; a positive zero adds -90° and 20 dB/decade. Controller design software often allows tweaking of these zeros and poles in compensators to fine-tune their effects in plant/compensator Bode (and complimentary root locus) plots. Once a desirable response is found, the controller is connected to a plant model in a feedforward or a feedback control loop, simulation is run, and resulting Nyquist plots reveal closed-loop system stability.
Special thanks to Dr. Patrick M. Flanagan, former professor at Cleveland State University, for input and inspiration.
Questions and Answers
Q: How are the Bode plots of a system found?
A: Originally the plots were constructed by hand using a set of approximating piecesparts. Now with computers, computational and experimental methods are easier and more precise. Sometimes the plots are generated with modeling software during design. Otherwise dynamic signal analyzers produce the helpful plots from measured signals collected from physical prototypes or working machines.
Q: What does the plot mean?
A: Bode plots compare input-output signals, and are thus a representation of a system’s transfer function. Like all ratios they prefer a log-base notation because it simplifies the manipulation of exponents. For example, when networks are cascaded so their gains multiply, the overall gain in decibels is found by simple addition. Bode plots are unitless on the vertical (ratio) axes. Along the horizontal axis, frequency steadily increases by a fixed percentage.
Q: How are the plots used?
A: Bode plots help in the design of system controls. Multiplying input by a system’s transfer function, or Bode plot, predicts the output. Conversely, by working backward from plots generated experimentally you can determine the Bode plot or transfer function itself. These plots reveal load effects, machine resonances, and (after a system’s mechanical characteristics are established) suitable electrical compensation techniques.
Definitions
Bandwidth: the frequency range 0< v . Related to settling time, bandwidth indicates the frequency where gain starts to fall off from its low-frequency value by 29.3% (or to -3 dB), which implies a less responsive system.
Decibel: a logarithmic measure of gain. An increase of 20 dB translates into an increase in magnitude by a power of 10.
Error: the difference between the required signal and the actual signal. Controls correct error.
Gain: expresses the increase of a signal’s power. It is the voltage ratio of error to output. Lowering gain in systems allows friction to damp vibration — at the cost of stiffness and positional accuracy.
Gain margin: the factor by which gain can be increased before a system becomes unstable. Increased loads and resonances limit gain increases because of the instability they induce.
Phase margin: additional phase lag that will make a system marginally stable. Gain margin expresses the same information in a different form. Phase margin is the open loop phase (when gain equals 1) minus 180° ... so the higher, the better.
About the Author
Voice Your Opinion!
To join the conversation, and become an exclusive member of Machine Design, create an account today!

Leaders relevant to this article: