Powerful Strategies for Keeping Manufacturing in the U.S.

American companies take many different paths when faced with the need to significantly reduce costs and improve profits. One long-term trend has been to move product manufacture and assembly from the U.S. to a foreign, low-cost labor geography. Before making a move of this type, however, it is worth considering some proven methods that can help your company understand whether the payoff will measure up to expectations. Total Cost of Ownership (TCO) and Boothroyd Dewhurst Inc. Design for Manufacture and Assembly (DFMA) software are two tools to consider for analyzing product costs in order to make data-based decisions with the best interests of the company in mind. I have used these approaches in leading Dynisco’s VAVE (Value Analysis/Value Engineering) Group.
Like many companies, we considered that moving manufacturing offshore might offer benefits. After a walk-through of our analysis, I felt compelled to share with others that keeping production in the U.S. with TCO and DFMA offered an 8% cost advantage over offshoring.
Real-World Product Example
A test instrument used for analyzing material during processing was selected for evaluation in 2015. The product has over 800 parts with a low annual volume.
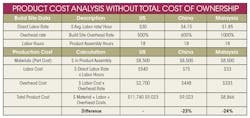
After looking at the existing product costs, we estimated what the labor and overhead costs would look like at the overseas facilities based on their labor and overhead rates. This resulted in much lower costs at the China and Malaysia build sites. While the overhead rates are higher at these two sites, applied overhead costs to the product are lower as they are a function of the labor cost. This estimate assumes no change to labor hours or materials costs for the product. Based on the differences in total product costs, it’s easy to see how one might think this is a simple decision to make—offshoring the work is more cost-effective. However, this is where a TCO analysis comes into play. TCO will account for costs to move and support production as well as other hidden costs, such as hefty travel expenses to provide engineering support or initial tooling and assembly cell costs, in order to sustain the product in a new location.
TCO Analysis Defined
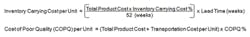
TCO is calculated based on a combination of known data and well-informed estimates about the product or part. First, each build site to be compared for TCO costs—typically between two to four sites—is labeled in its own column for quick comparisons of each input and result. The product’s annual volume and site-specific lead-time are entered, followed by the site labor rate, total assembly time, total material costs, and total overhead. Next, the “total landed cost” is entered for each site. Total landed cost is defined as the cost of shipping/freight, insurance, and duties from each site.
Rounding out the remaining TCO inputs are the cost of poor quality (COPQ), build-site profit, inventory carrying costs, reoccurring costs, and one-time transition costs. COPQ, build-site profit, and inventory-carrying costs are percentage estimates that are calculated against the total product cost at each site and added to the total cost in terms of cost per unit.
Reoccurring costs are defined as the travel expenses for sending engineers or other company personnel overseas to support the product. Flight costs add up quickly if, say, an engineer has to fly three or four times a year from the U.S. to the Asia region. Then one-time transition costs are added in for any tooling and equipment costs required to set up assembly cells overseas.
The final piece of the TCO analysis is the input called “risk factor.” We use 17 different risk factors that are assigned a weight of impact and probability of occurrence. Examples of risk factors are: inflation, quality (losing the design “recipe,” no engineers at the new build site who know the product and nature of past design decisions), currency differences, and intellectual property (IP) transfer (IP theft). Each of the 17 risk factors are assigned a weight, 1 through 17, and a 0-100% probability of occurrence. The weight and probability are multiplied together to determine the value for each risk factor. For instance, one build site might assign IP transfer at the highest weight of 17 with a 100% probability of occurrence. The risk factor for IP transfer would equal 17%. The remaining 16 risk factors are then handled in the same manner until all have their own risk-factor value. The average percentages of these seventeen risk factors are then multiplied with the total product cost for the risk factor cost per unit.
TCO Analysis Results
Looking at the year-one TCO totals for the example product shows the TCO costs per unit if the material analyzer were moved to the China or Malaysia build site. When we compared the product labor and overhead costs in China and Malaysia to the baseline costs, there was an estimated cost savings of -23% and -24% per unit, respectively. Adding in the TCO costs, though, shows that the year-one anticipated savings per unit drop to only -2% for the China site and -9% for the Malaysia site. Based on those numbers, it might still be appealing to go after the 9% savings by moving production to Malaysia. However, I have seen VAVE efforts commonly surpass 9% cost reductions on products. The next section will review what the DFMA analysis uncovered.
DFMA Application
Boothroyd Dewhurst’s DFMA software is used for product simplification and cost improvement by many companies. User surveys show a typical product cost breakdown of 72% parts, 4% labor, and 24% overhead. Dynisco can support this, as we have sampled some of our own products and found similar results. For instance, the example product’s cost breakdown was 72% parts, 5% labor, and 23% overhead. This is why, as practitioners of DFMA, we focus cost improvement efforts on where the majority of the product costs lie: within the parts.
The DFMA process starts by entering a product bill-of-material with part costs into the DFA software. The bill-of-material is adjusted to the best known order of assembly to complete the product structure. For example, parts, subassemblies, and additional operations are in the assembly sequence. The minimum part criteria questions are then answered for every part in the assembly. A base part is assigned and then, for each part added to the assembly after the base, the DFA user answers the following three questions in relation to all other parts before it in the assembly:
1. Does the part move relative to all other items?
2. Must the part be a different material?
3. Does the part have to be separate to allow assembly? If a part does not meet any of the three minimum part criteria questions, it is considered a candidate for elimination.
These three questions make up the DFA theory/philosophy that is the catalyst for engineers to discuss and generate ideas on how to combine parts for function or eliminate them altogether from the product design. DFA is essentially creating a virtual product-assembly cell and routing estimate for the user based on all of the analysis inputs. The goal with DFA is to minimize the total number of parts, improve ease of assembly through labor time reduction, and ultimately minimize product cost with this approach.
The DFM side of the software is then used to analyze the “should-cost” of parts in the product assembly. DFM provides detailed manufacturing cost estimates for a variety of material and process combinations. Used on existing production parts, the DFM cost estimates can then be compared to supplier costs to determine what the company “should” be paying. When applied towards newly designed parts, DFM provides an early cost estimate for engineering teams at an important phase in product development.
I have used this approach many times and conducted a full DFMA baseline analysis on the material analyzer to identify opportunities for cost reduction. We also held a two-day workshop between my VAVE group and fellow engineers from our sister company to brainstorm for cost reduction ideas. The DFA analysis on the 800+ part assembly identified over 100 parts as candidates for elimination. DFM was used to analyze over 50+ manufactured parts that made up almost 40% of the material costs and found that the should-cost estimates were 32% lower than the supplier prices. This means there is ample opportunity to work with suppliers to identify cost drivers and look for ways to lower manufacturing costs. Overall, the DFMA effort showed there was potential for 15%+ opportunity in cost reduction on the product through DFA design improvements, labor time reduction, and capitalizing on the DFM data, all without moving to another build site.
Data-Based Decision
Again, the goal of performing the TCO and DFMA analysis was to cost reduce the product by either building overseas or through making design changes. The table below shows the final analysis summary for all of the steps taken in order to make the final decision.
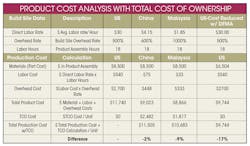
Based on our TCO and DFMA analysis, the decision was made to keep the product at the current U.S. build site. The TCO analysis determined that the year-one cost savings would only be 2% or 9% lower than the baseline or existing build site. Collectively, two major items factored greatly in the decision. IP transfer was a risk the company was not willing to take from building in another country and the DFMA analysis showed the potential for greater than a 10% cost reduction over the next year. Therefore, sustaining activities—such as implementing to production the cost-reduced design changes and labor time improvements identified in the DFMA workshop—have begun to cost-reduce this product. The end result: A 17% baseline improvement by continuing production in the Midwest—8% more cost-effective than Malaysia.
Trust the Tools
As I mentioned at the outset, companies have a wealth of options when it comes to what particular engineering, supply chain, and operations methods they choose to reduce costs, increase profits and sustain their domestic manufacturing assets. No matter what is chosen, one thing is central: finding the people who can become the subject-matter experts and help develop project teams to correctly use tools such as TCO and DFMA. Our advice is to encourage and deploy people who can work with finance, purchasing, engineering, and other departments to gather data and share ideas and opinions on the various costs that go into making the target product.
Through my experience, I advocate a top-down approach for implementing programs such as these. Strong support from upper management is critical. Grass roots initiatives at a company, while noble, are slower and more difficult. Still, finding opportunities to present analysis results and benefits from these programs to cross-sections of the company is important towards building buy-in from others for either approach to implementation.
A further note: strategies such as TCO, DFMA—and even Value Engineering—need to be viewed and applied more broadly than they are now. Mention one of these tools and the first thought by engineers and managers is often that they are for “special cost reduction” situations or are the “ideal costing tool” used exclusively by the VAVE team. But any DFMA, TCO or Value Engineering veteran will tell you that these are everyday tools that can be an important part of product development. These programs are really about optimizing product costs while maintaining function and quality. Yes, the techniques are also valuable for legacy parts, but their biggest value is realized when put into play right up front, and used every day.
The Home Court Advantage
One of the most unfavorable impacts of building parts and products away from home—and a frequently overlooked point when deciding to do so—is its effect on continuous improvement. For most U.S.-based companies, the engineering team is still in the States. That presents solid opportunities for TCO organizational collaboration and DFMA workshops and brainstorming sessions that otherwise wouldn’t take place when working across multiple time zones. Moreover, anytime a product design is modified, new quotes from suppliers and additional DFM on downstream parts are likely required. Issues crop up here that would be difficult to resolve without an engineer or product designer onsite. The product development process as a whole is far more manageable if done in-house, we have found. It is often easier and more profitable to serve a major market such as the U.S. from a headquarters and plant within that market.
Matt Miles is the DFMA and value engineering manager at Massachusetts-based Dynisco Instruments. Matt’s background is in mechanical engineering with over 17 years of product development experience.

About the Author
Matt Miles
DFMA and Value Engineering Manager
Voice Your Opinion!
To join the conversation, and become an exclusive member of Machine Design, create an account today!

Leaders relevant to this article: