An Alternative for Fitting Straight Lines to Data
Most straight-line approximations for data points are found using the method of least squares. This method works for many applications, but it cannot guarantee that the greatest vertical distance between experimental data points and the straight-line approximations are at a minimum. Finding a straight-line approximation that meets this requirement, known as the “least minimum deviation,” is important in such tasks as calibrating instruments when the least accurate reading must be as accurate as possible.
A simple graphical method was developed to find the “best-fit” straight line, that is, the line the creates the smallest maximum deviations. It requires that users:
* Plot all experimental data on graph paper with Cartesian coordinates.
* Draw a convex polygon that uses each experimental data point at one of the polygon’s vertices or lies inside the polygon.
* Draw a vertical line form each vertex to its opposite side if the vertical falls within or on the polygon.
* Find the longest of these vertical lines. This is the maximum deviation span (MDS).
* Find the midpoint of the MDS.
* Draw a line through this midpoint and parallel to the side intersected by the MDS. This is the “best-fit” line, giving the smallest maximum deviation from the experimental points.
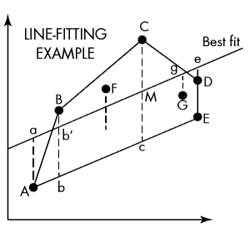
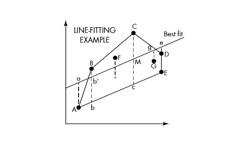
The three vertical lines that fall within or on one side of the polygon are Bb, Cc, and Ee. The longest of these is Cc, so the line that best fits the points is drawn parallel to side AE and though point M on line Cc.
Because the best-fit line is parallel to side AE, then Aa, CM, and Ee are all equal to each other. They are also longer than Bb’, Ff, and Gg, so they represent the maximum deviation (vertical distance) between any experimental point and the best-fit line.
If the best-fit line were raided, Aa and Ee would increase, and the maximum deviation would increase. If the best-fit line were lowered, CM would increase and the maximum deviation would increase. Because points A and E are on the opposite side of the line from point C, any rotation of the best-fit line would increase the length of at least one of Aa, CM and Ee, again increasing the maximum deviation. Therefore, the best-fit line is the one with the least maximum deviation from the experimental points.
